Robust and plentiful data can be a source of valuable insights about customers, competition, internal business operations and the larger value chain. By applying the appropriate statistical and data analysis techniques, insights can be extracted from the raw data which can inform strategy.
We currently provide the following data analysis services:
1. Data Engineering and Exploratory Data Analysis (EDA).
Datasets are reviewed, and inconsistencies and errors are managed. This data is then used to uncover initial relationships, trends and insights, based on the business question(s) at hand. Common techniques include univariate and bivariate analysis, cross-tabulation, pivot-tables, histograms, boxplots, barplots, scatter plots, pairplots, feature engineering etc.
2a. Statistical Data Analysis.
- Descriptive Statistics:
Mean, median, mode, range, standard deviation etc.
- Inferential Statistics:
Hypothesis testing based on the normal distribution. Tests that we currently support are the T-test, Z-test, Proportion tests, Variance tests, Chi Squared test (Variance, Independence, Proportions), ANOVA.
2b. Statistical Process Control.
This comprises of Control charts (ImR/XbR), Process Capability - Cp/Cpk // Pp/Ppk, Guage R&R (Crossed and Nested).
3. Machine Learning (ML) Techniques.
3a. Unsupervised ML.
This is useful for getting a deeper understanding of a dataset. Defining dependent and independent variables is not needed. The resulting insights can be used to draw conclusions and to help design further analyses and supervised ML studies on the data.
The two unsupervised ML techniques offered are:
- Principal Component Analysis (PCA).
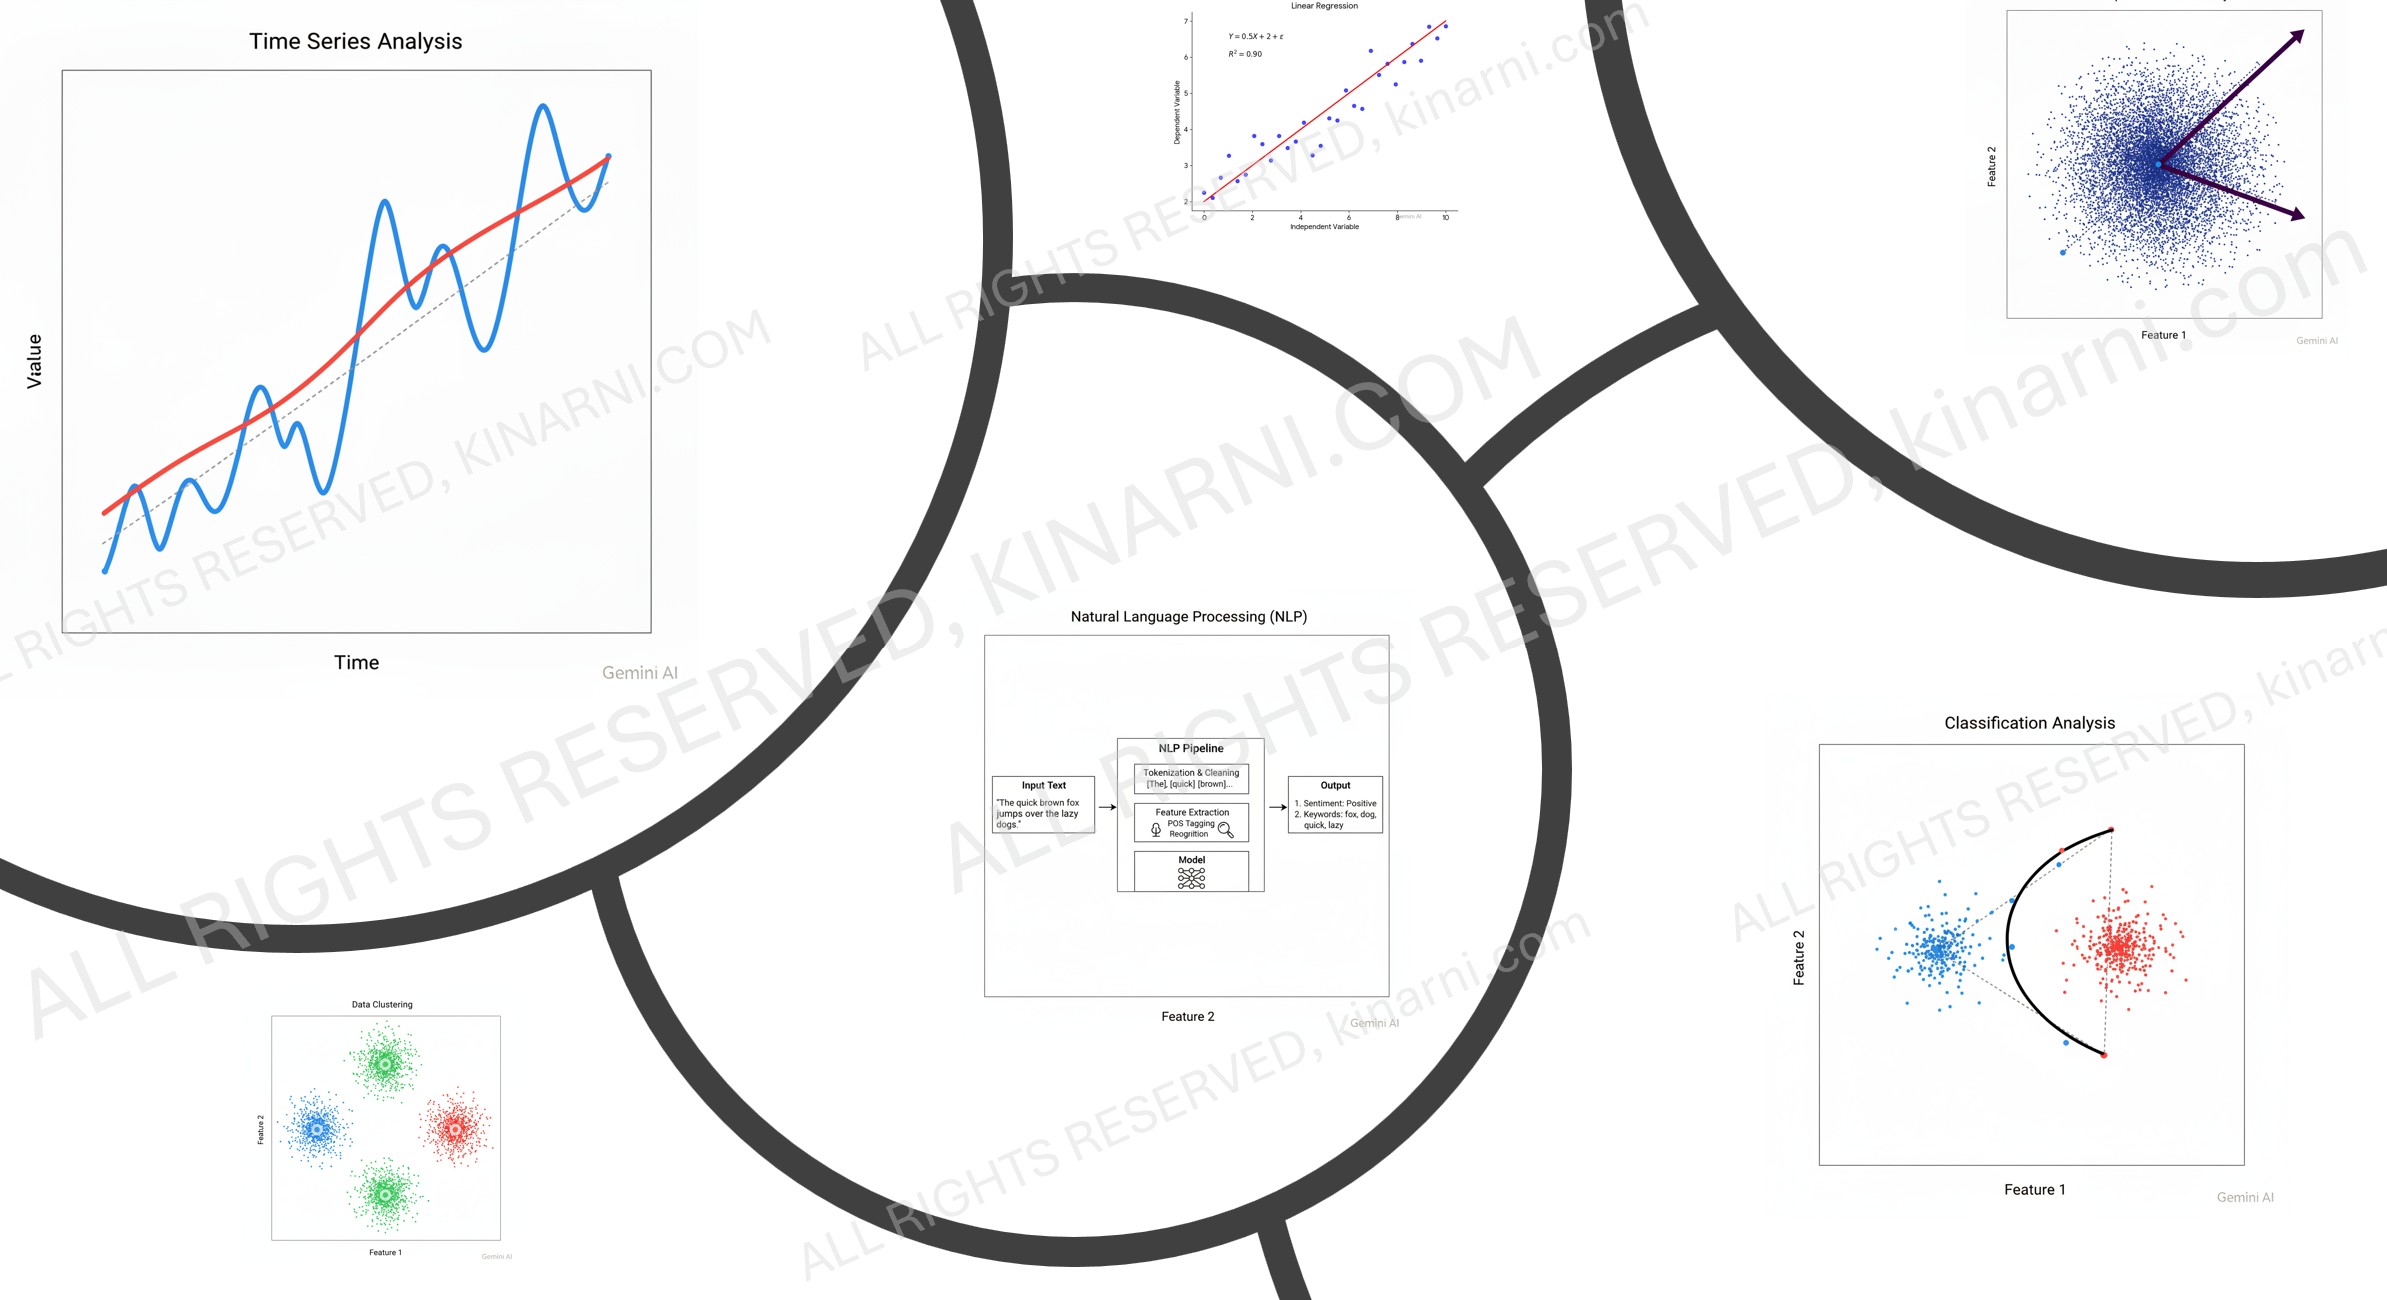
PCA is useful when the data has a large number of variables / features / columns. PCA can be used to reduce the number of features, often without too much loss of information contained in the data. It can reduce covariation / collinearity and provide improved insights on the sources of variation, and trends in how variables in the data change with respect to each other.
- Clustering.
Clustering is useful for understanding grouping trends in the data and also for identifying the presence of outliers.
3b. Supervised ML Techniques.
These are useful for making predictions based on analysis of historical data. A clear definition of dependent and independent variables is required.
Techniques supported are Linear and Non linear Regression, Classification, Time Series Analysis, Artificial Neural Nets (ANN's) and custom analyses.
4. Currently only limited Natural Language Processing (NLP) techniques are supported.